A Data-Driven Report for Congress
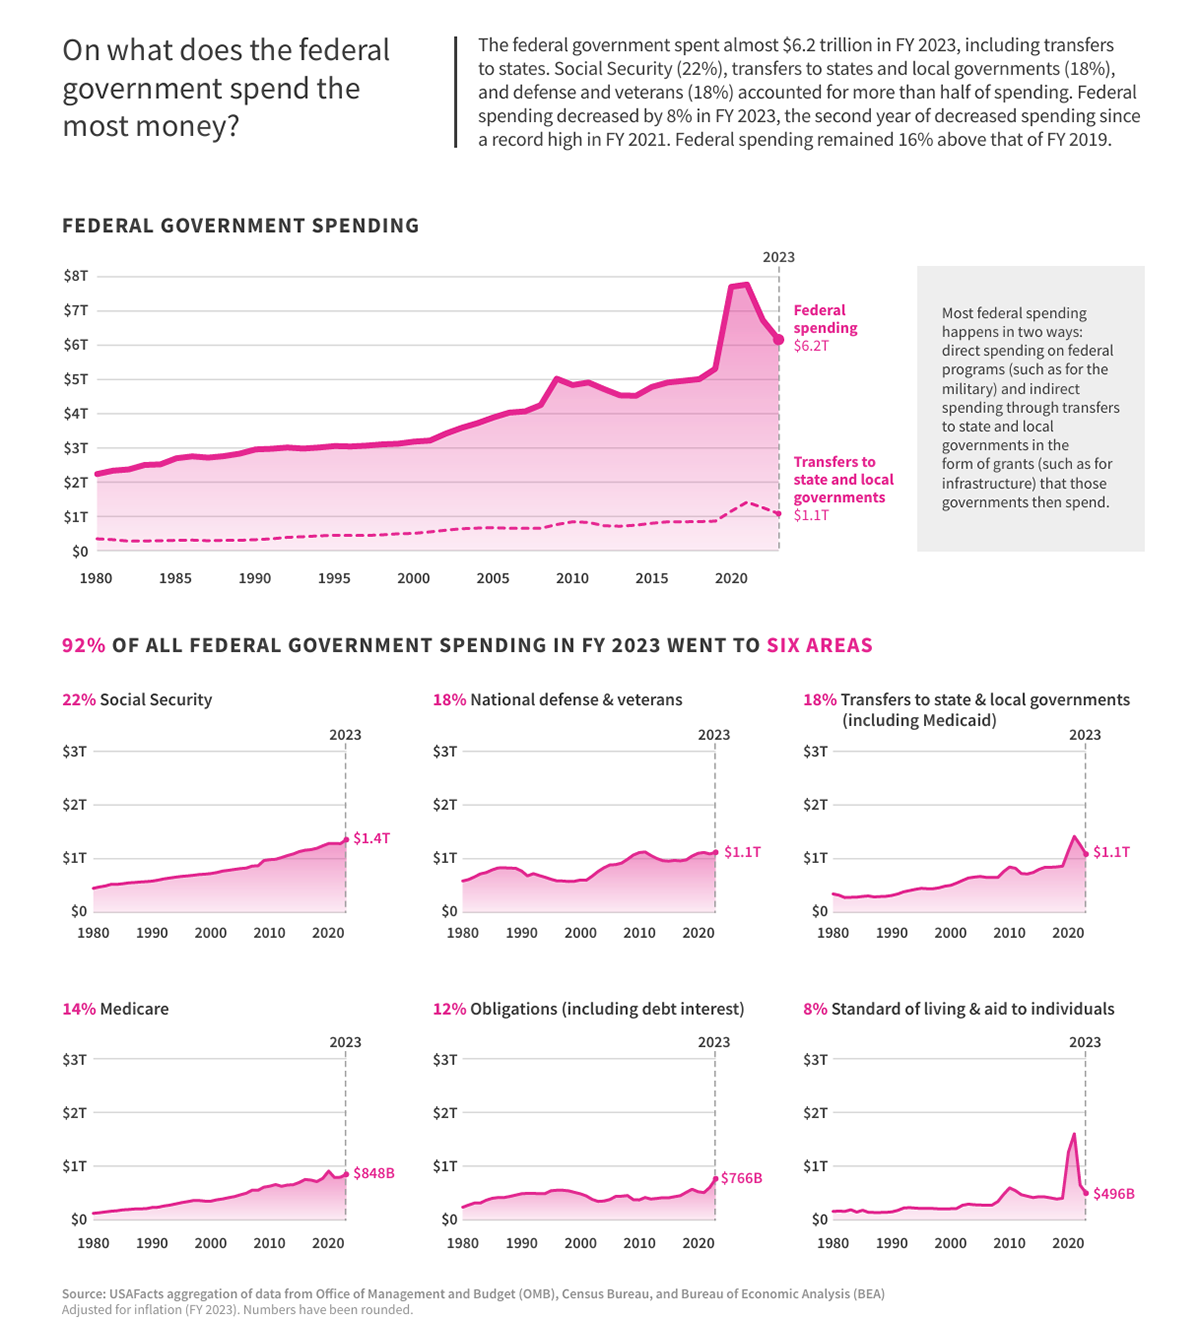
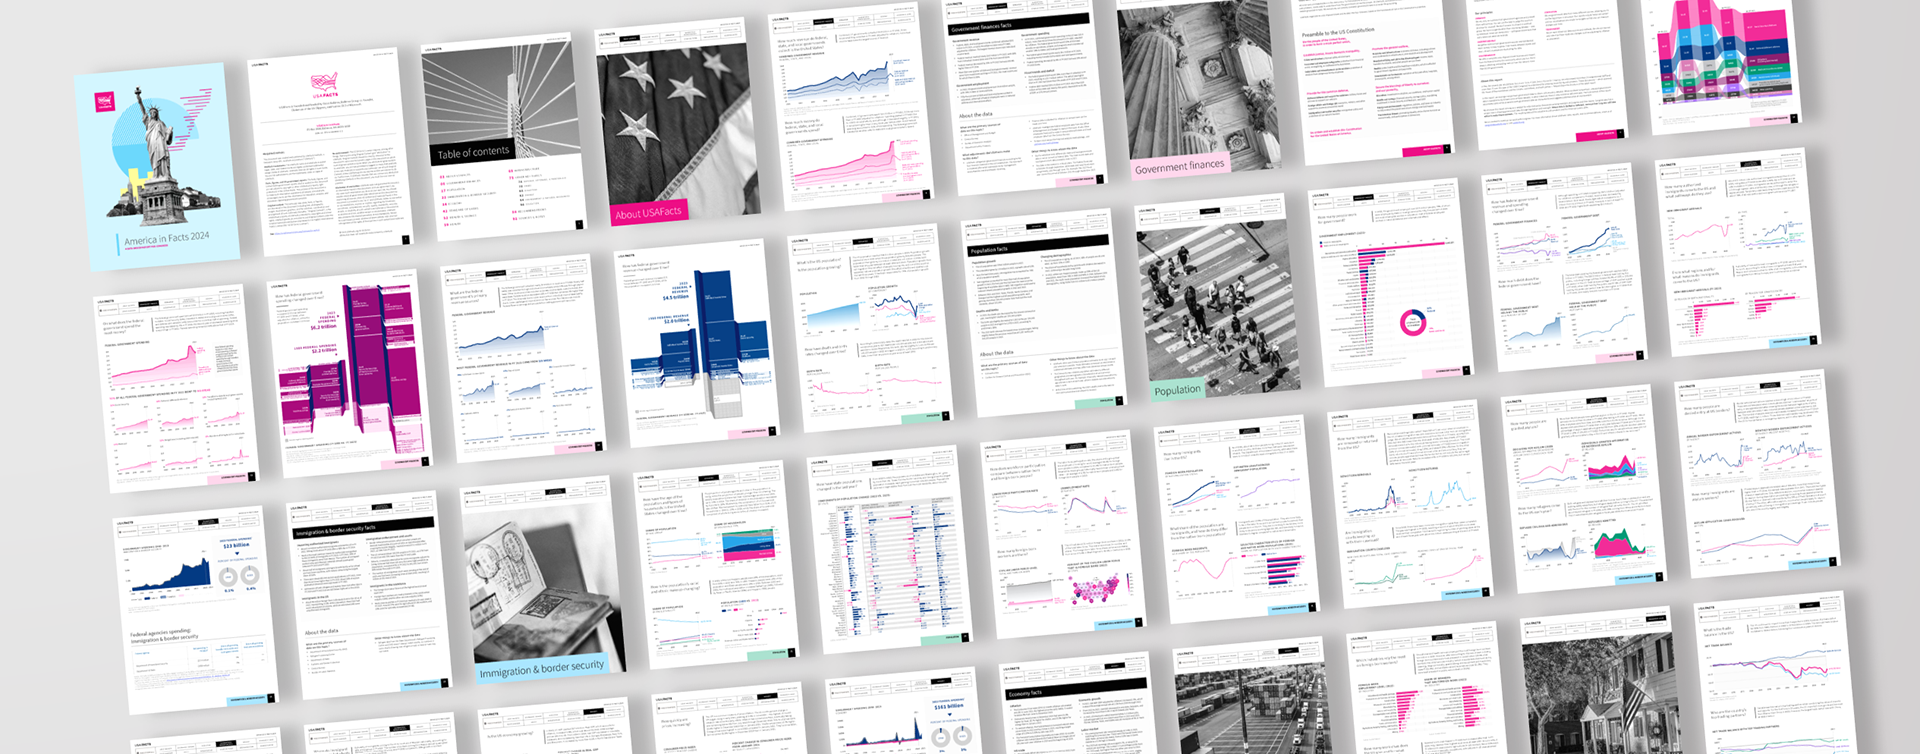
I led creative direction, data visualization strategy, and chart design for USAFacts' 2024 America In Facts: A Data Driven Report for Congress, an annual report highlighting nonpartisan insights on the nation's population, economy, health, and other key policy areas that inform policymaking. I collaborated with USAFacts' internal team and external agency resources (we partnered with Material on document layout production in InDesign) to produce this document over a ~12 week period. I also helped with data preparation, proofreading, and putting the finishing touches on both versions for digital and print. In most cases, the charts were designed in Excel and Adobe Illustrator, and a handful with Flourish. After print publication, we prepared variations of the charts for use on social, both static and animated.
In addition to brand and data visualization strategy, I've supported USAFacts' Annual Report initiative for a number of years in the role of creative director, data visualization strategy, and lead for chart design. (See 2023, 2022, 2021, 2019, 2018, 2017.) Since the first 300-page PDF we launched back in 2017, the evolution has been remarkable—how we present data, how we highlight key learnings, how we decide what's most important. I'm super proud of this work and to be a part of USAFacts' mission to make government data more accessible and easy to understand.
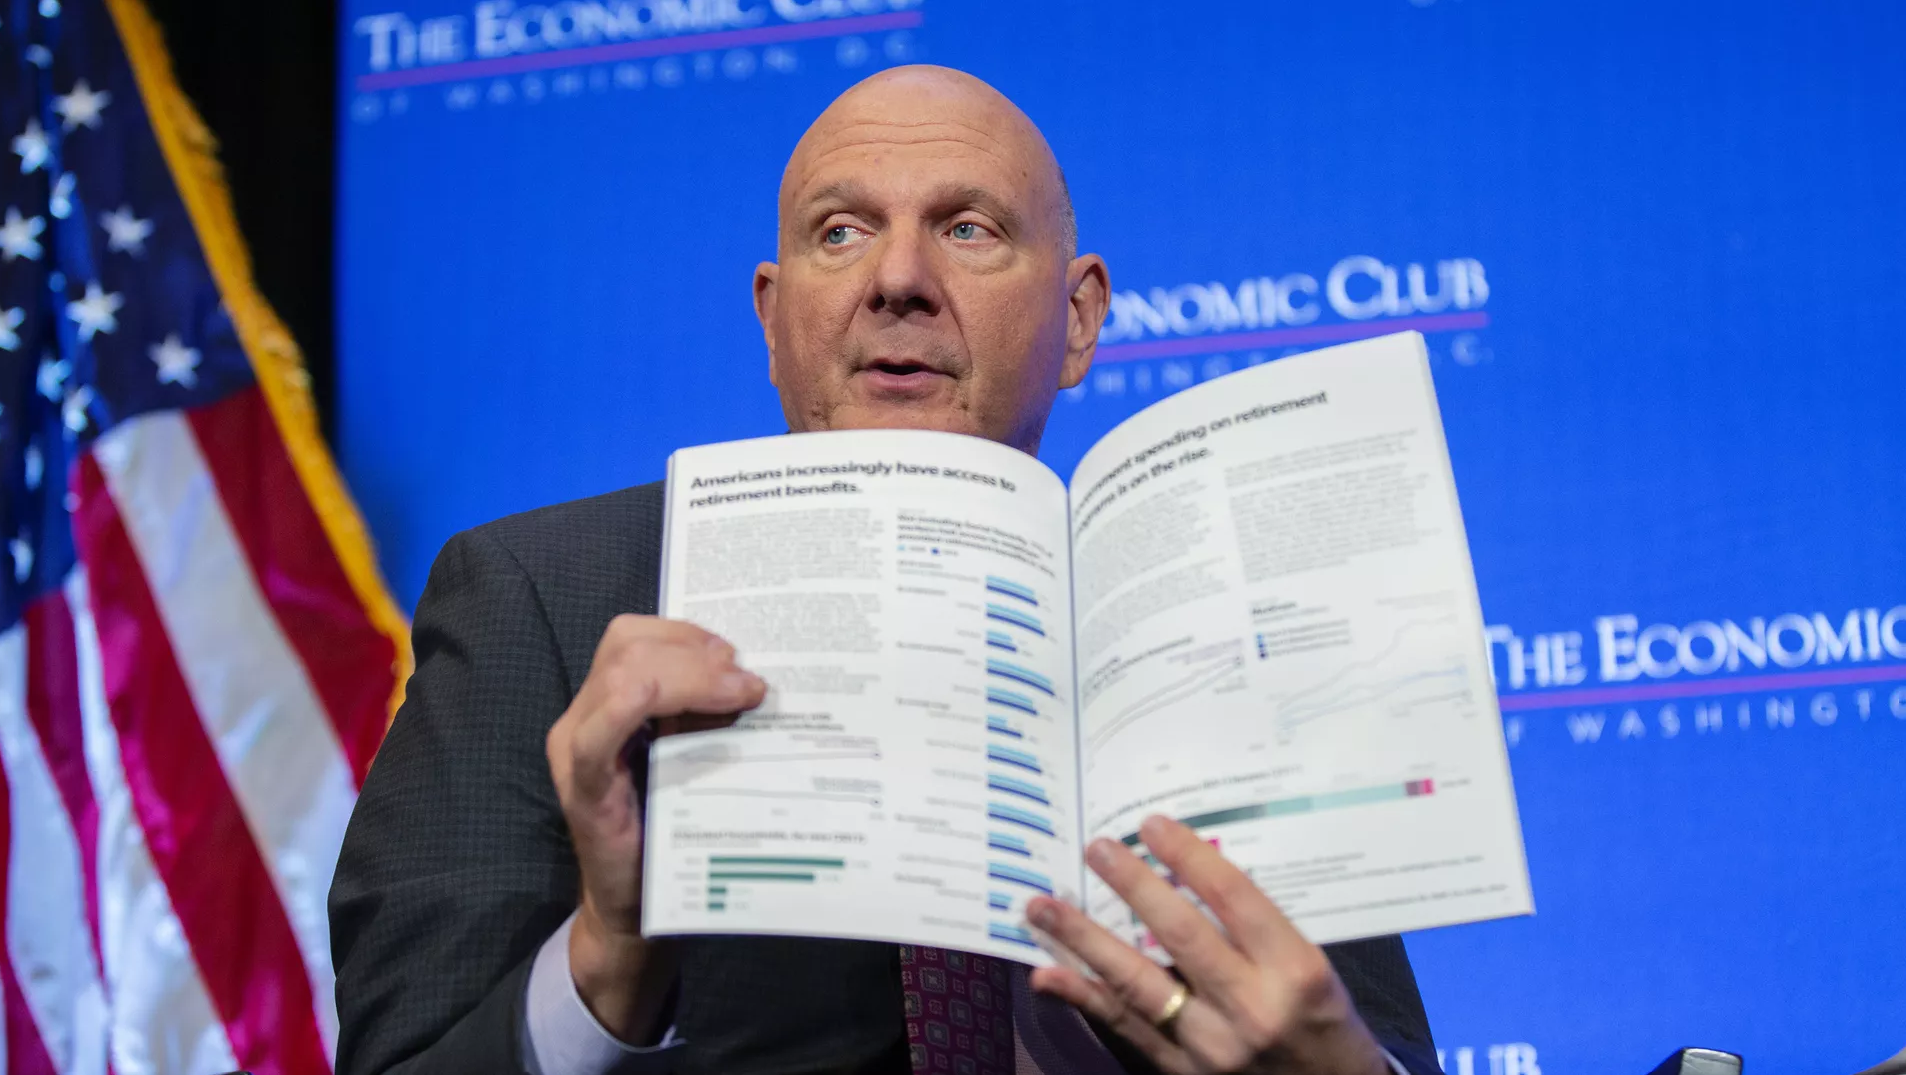
Steve Ballmer showing off a copy of the 2019 Annual Report at the Economic Club in Washington, DC to members of Congress.